

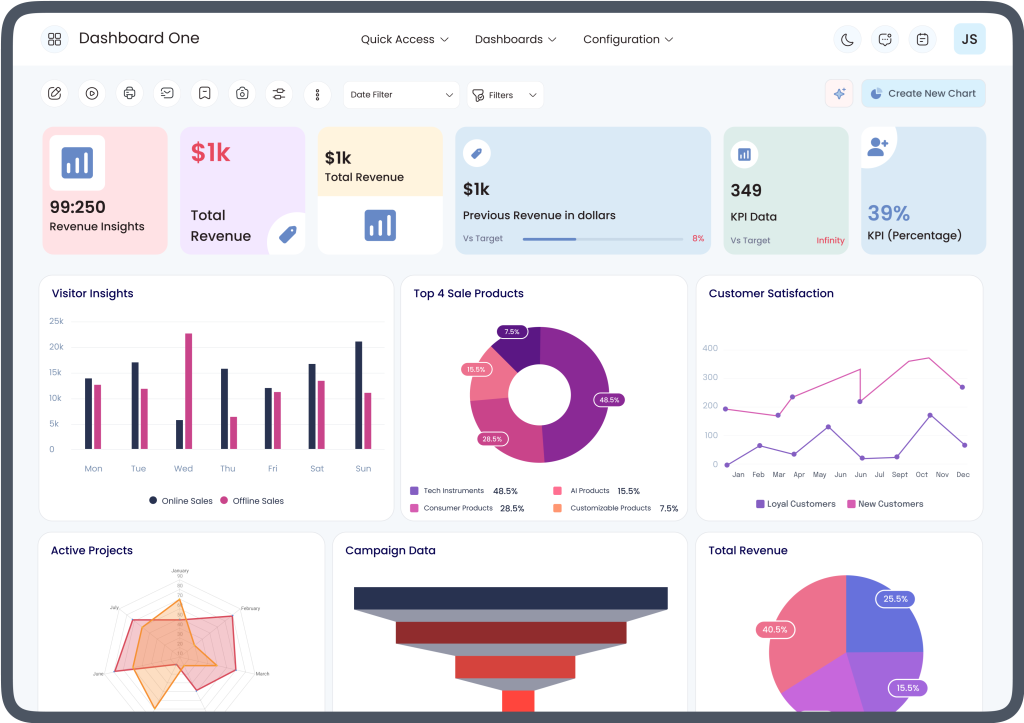
In today’s fast-paced corporate environment, managing vast amounts of operational data across multiple departments can quickly become overwhelming. Modern businesses rely on integrated Enterprise Resource Planning (ERP) software to handle sales, inventory, accounting, and customer relations, yet extracting actionable insights from raw data remains a formidable challenge. Without centralized visualization tools, key stakeholders often find themselves drowning in complex spreadsheets or making critical choices based on outdated metrics. Implementing a specialized Odoo KPI dashboard bridges the gap between raw database entries and strategic management, empowering executives to monitor real-time performance, streamline daily workflows, and accelerate sustainable business growth across every operational department.
What Role Do Centralized Dashboards Play in ERP Systems?
An Enterprise Resource Planning system serves as the digital brain of an organization, recording every transactional event, stock movement, customer interaction, and financial entry. However, raw database entries are inherently difficult to interpret at a glance. Centralized dashboards convert this chaotic flood of numbers into intuitive, visual interfaces featuring interactive graphs, heatmaps, progress bars, and high-level summaries.
By consolidating multi-departmental information onto a unified screen, modern reporting platforms solve several operational hurdles:
1. Eliminating Data Silos
In traditional business structures, the sales team utilizes one reporting tool, inventory managers track stock on separate spreadsheets, and the accounting department uses dedicated financial software. Centralized visualization gathers information from all operational modules into one accessible location, ensuring that every team operates from a single source of truth.
2. Enabling Real-Time Decision Making
Relying on end-of-month or quarterly static financial reports means management is constantly looking in the rearview mirror. Dynamic, real-time reporting displays live transactional updates as they occur, allowing managers to spot operational bottlenecks, inventory shortages, or sudden dips in conversion rates the moment they happen.
3. Improving Executive Efficiency
C-suite executives and division managers rarely have the time to filter through thousands of database lines to check organizational health. Customizable summary screens highlight critical Key Performance Indicators (KPIs), allowing decision-makers to assess business performance in seconds and focus their attention where it is needed most.
Key Operational Metrics Every Modern Enterprise Should Track
To maximize the value of dynamic visual reporting, organizations must select and display the metrics that directly align with their strategic goals. Depending on your industry and business model, key reporting modules typically focus on three core areas:
A. Sales and Revenue Generation
Tracking sales velocity and revenue trends is vital for maintaining healthy cash flow and predicting future demand. Essential metrics include:
- Monthly Recurring Revenue (MRR) and Gross Margins: Monitoring top-line growth and true profitability across product lines.
- Sales Pipeline Conversion Rates: Identifying how effectively leads transition from initial contact to closed deals.
- Average Order Value (AOV): Tracking fluctuations in purchasing habits over specific promotional periods.
B. Inventory and Supply Chain Management
Overstocking ties up valuable working capital, while stockouts lead to lost revenue and dissatisfied customers. Critical inventory metrics include:
- Inventory Turnover Ratio: Measuring how quickly stock is sold and replaced over a given period.
- Order Fulfillment Lead Times: Tracking the duration from initial order placement to final delivery.
- Dead Stock and Shrinkage Levels: Identifying slow-moving inventory before it becomes obsolete.
C. Financial and Accounting Health
A healthy balance sheet is the foundation of long-term business sustainability. Crucial financial indicators include:
- Accounts Receivable Aging: Monitoring overdue customer invoices to reduce bad debt exposure.
- Accounts Payable Timelines: Managing outgoing cash flow to maintain positive vendor relationships.
- Net Profit Margins and Expense Ratios: Keeping operational overhead aligned with revenue growth.
How Custom Analytics Drive Operational Optimization
Off-the-shelf reporting views often fall short of meeting the nuanced requirements of growing companies. Generic reporting tools can display basic charts, but custom visual analytic solutions allow enterprises to build tailored dashboards that match their exact workflows and industry demands.
Custom visual reporting platforms offer several advanced advantages:
- Interactive Drill-Down Capabilities: Users can click directly on high-level chart elements to investigate underlying invoices, purchase orders, or customer profiles, making root-cause analysis fast and intuitive.
- Role-Based Access Controls: Executive teams can restrict sensitive financial metrics while granting store managers access to local inventory and regional sales figures, safeguarding data security.
- Cross-Module Data Blending: Advanced analytics connect seemingly unrelated data points—such as linking marketing spend with long-term customer lifetime value—to reveal deep operational insights.
Transforming Raw ERP Data into a Competitive Advantage
As business operations expand, the ability to rapidly analyze, interpret, and act upon complex operational data becomes a major competitive differentiator. Organizations that rely on static, fragmented reporting risk falling behind agile competitors who leverage dynamic analytics to optimize supply chains, refine marketing strategies, and improve customer satisfaction.
Investing in tailored visual analytics platforms gives management the clarity needed to navigate evolving market landscapes with confidence. Whether you are aiming to enhance overall corporate performance or leverage specialized Odoo analytics for eCommerce, dynamic reporting tools transform raw database entries into strategic assets. Equipping your leadership team with real-time, actionable insights unlocks greater operational efficiency, drives revenue growth, and secures long-term market leadership.